Paul & Cal Drive times to school

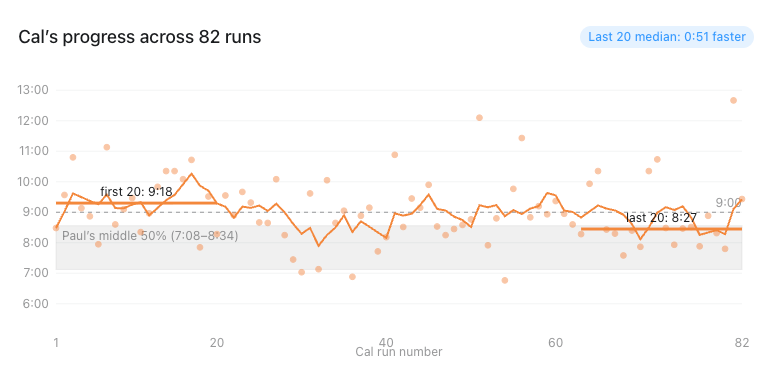
Calvin and I tracked our time to drive to school for the 2025/26 school year. Cal got his permit around half way through the year so we kept track of my times vs his times.
ChatGPT did the analysis.
Main findings:
The main findings:
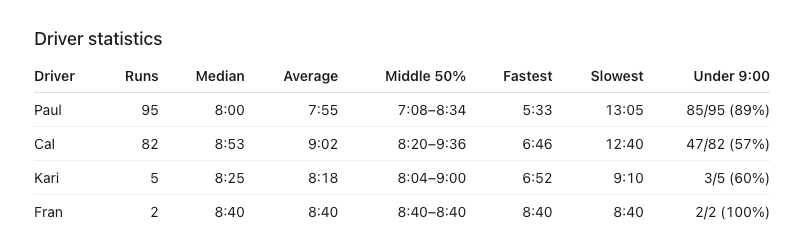
- 184 runs across 140 dates, totaling 25h 50m of tracked driving.
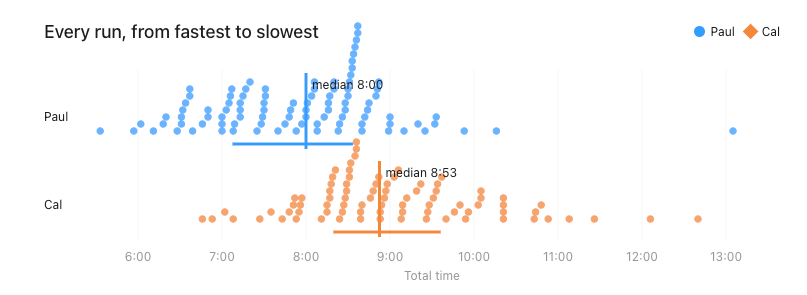
- Paul’s typical time was 8:00; Cal’s was 8:53—a raw median difference of 0:53.
- On the 14 dates both drove, the median Cal–Paul gap was 1:09. Cal was faster once: 6:46 versus 7:09 on April 19.
- Both drivers had almost identical trip-to-trip variability—about 1:06 standard deviation. Cal’s results weren’t substantially more erratic; his whole distribution was mostly shifted slower.
- Records: Paul’s fastest was 5:33; Cal’s was 6:46. The slowest were 13:05 and 12:40, respectively.